Word On The Street (WOTS) Dashboard Report
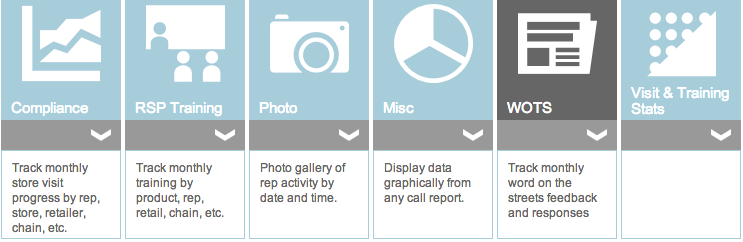
WOTS dashboard report shows the statistics (pie charts) based on the data from Word On The Street report submitted by various representatives and field staff.
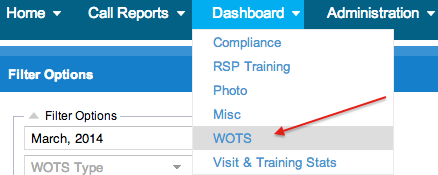
Click "WOTS" from Dashboard sub menus to land on WOTS dashboard report.

Graphical view vs. Data view:
There are two views (tabs) in this report page: 'WOTS' tab and 'WOTS Data' tab. 'WOTS' view (default) gives graphical representation (pie chart) of results, where as 'WOTS Data' view gives tabular view of results. Data view shows the result on the page as well as give the option to download the report as excel spreadsheet.
Filter Options:
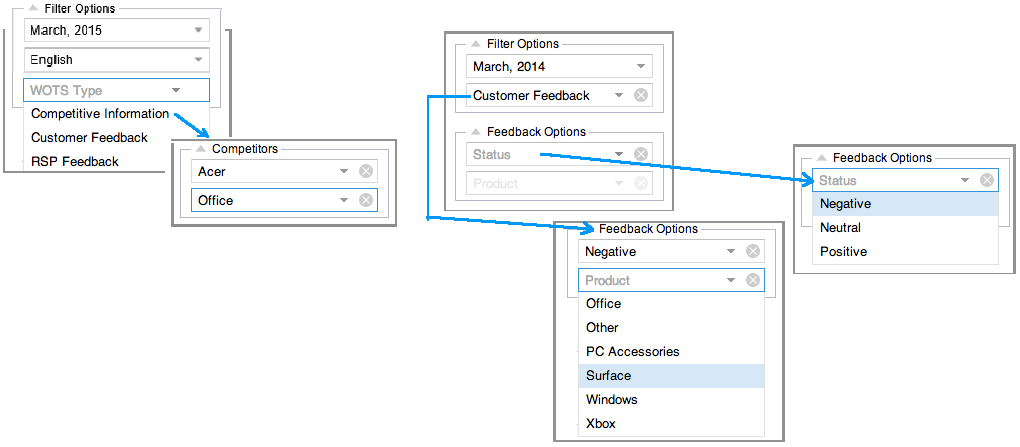
Basically there are 3 top level filter options.
One is a 'month,year' filter option.
Second is the 'Language Selection' to review localized Word On The Street feedback. Reporting users and Admins can use the language selection box on the left to choose what language the chart and legend are displayed in.
The third is 'WOTS Type' filter option. It has 3 options: 'Competitive Information', 'Customer Feedback', 'RSP Feedback'. Choosing one of these three options will expose associated sub-filters as shown in the pictures below. Data selection / filtration of these filters are based on the semantics of various questions and response types in WOTS form.
Note:
Admins must use Language Tools (Call Reports > Manage) for the WOTS report to make this work.
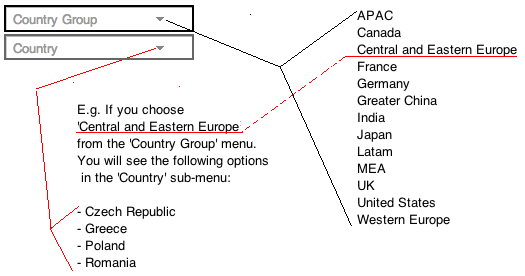
For Global Read Only Users, 'Word on the Street' report will show 2 additional location based filtering options 'Country Group' (A13) and 'Country' as shown below.
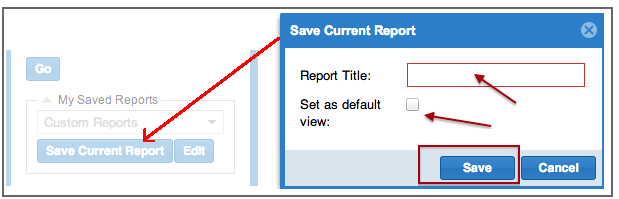
My Saved Reports:
You can also save the current query/filters by clicking on the "Save Current Report" button at the bottom on left pane. It opens a pop up windows where you can enter your preferred title for the query. Checking the 'Set as default view' box will ensure this query is run by default the next time you come to this report. "Edit" button beside 'Save Current Report' button lets you choose and edit one of the previously saved report queries.
On the bar graph, you can drill into more details double clicking on the bars (E.g. To view the individual visits to a store). Corresponding filter condition is automatically set on the left pane. You can also hover your mouse cursor over the bars to get more details.
Saving / Downloading the WOTS Chart:
The "Save Chart" button in the upper right hand corner of the chart area allows you to save / download the chart as a PNG file image or a more flexible Excel file. Once in Excel, you have access to the data table and chart formatting tools.You can use the PNG image in email correspondence, reports and presentations.
Export to Excel in WOTS detail:
Now users can drill drilling down (clicking) all the way into the parts of the chart. The WOTS submission detail will now include an export button in the upper right hand corner, providing a way to download, analyze and share WOTS data.
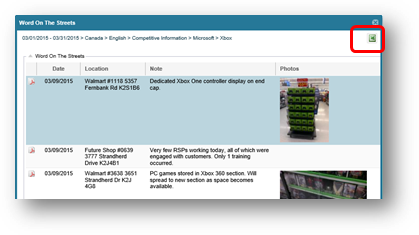
Note:
While logged into the MSFTREPS.com site, click any photo link in the spreadsheet to view or save the photo.