Miscellaneous Report Dashboard
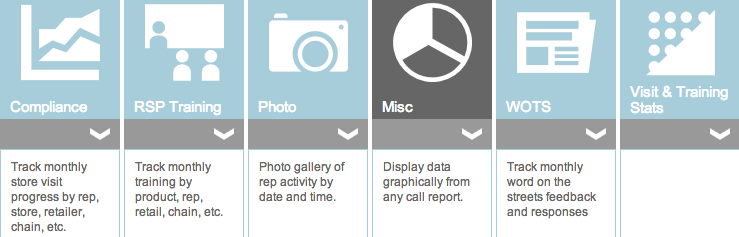
Miscellaneous report in Dashboard allows reporting based on all measurable fields in call reports such as 'Yes' or 'No' questions, pre-defined drop-down list items, multi-select boxes etc. This is probably the most sophisticated reports of all as user can generate adhoc reports specific to chosen call report fields, enabling the user to examine response statistics on a specific question. The reports (like in other reports), can be viewed or exported for presentations, discussion and other uses.
These are the steps to generate a 'Misc' report.
Step 1:
Select the required month from the left filter. The available call report list is now dynamic according to what month is selected to the left.
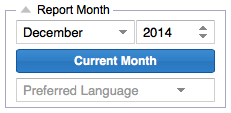
After you select the month and year, the drop down list includes all reports that were active and had submissions for that period.
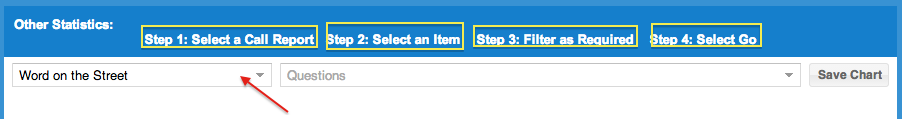
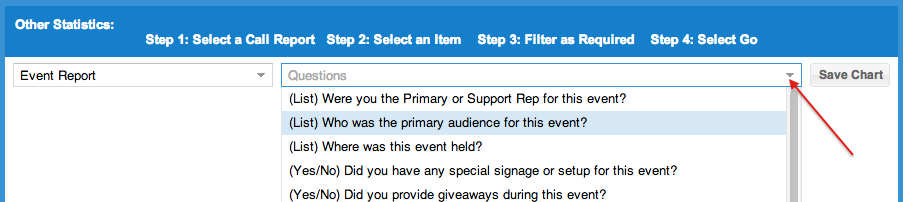
Step 2:
Select a Report Question Item. Here is where you can can scroll to find the question you want to isolate on.
Step 3:
Use Filter Options on the left side panel to streamline your results. Various report-months can be chosen or current month (default) can be chosen.
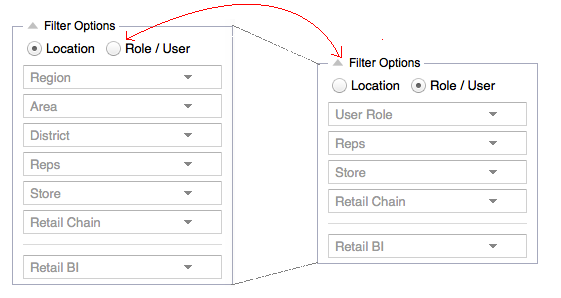
Just like in other dashboard reports, under Location category, you can apply sub-filters based on regions and sub regions as designed in store management page. User / Role based filters allow sub filters based on various user roles defined in user management page. For a selected user role, you can further filter on individual user names and the stores the user is assigned to. Both user role based and location based filter options allow Retail Chain and Retail BI sub filters to focus the results on the line of business.
Note:
In the first step above, if you choose WOTS or Event Reports, 'Retail Chain' or 'Retail BI' filters will not be displayed.
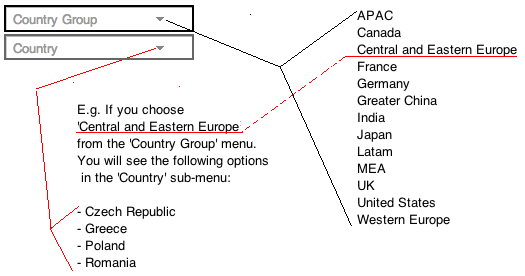
For Global Read Only Users, 'Training Engagements' report will show 2 additional location based filtering options 'Country Group' (A13) and 'Country' as shown below.
Step 4:
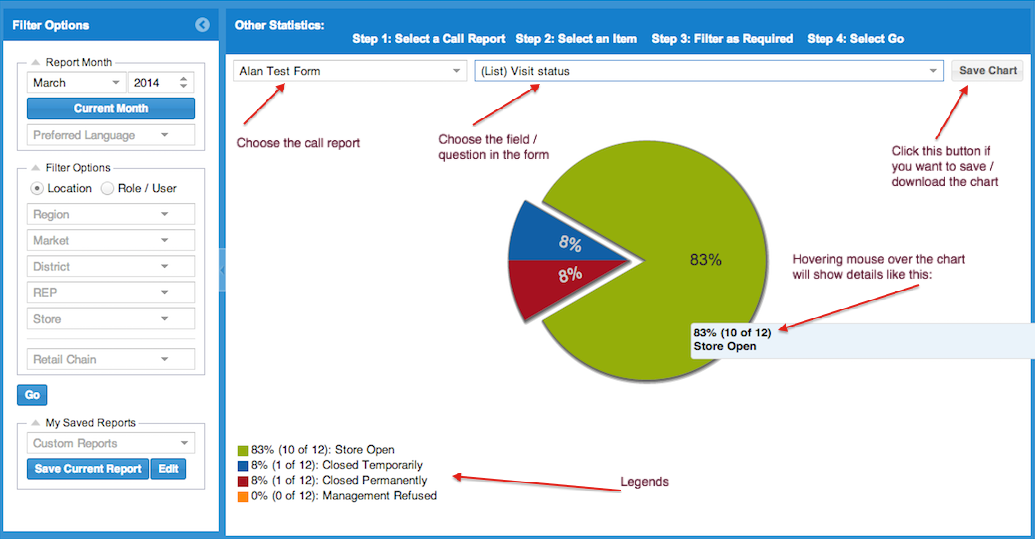
Once you choose the filters, click on the 'Go' button. It will generate the report graph as a pie chart, with legends at the bottom.
You can save / download the image of the graph by clicking on the 'Save Chart' button at the right top corner.