RSP Training Report Dashboard
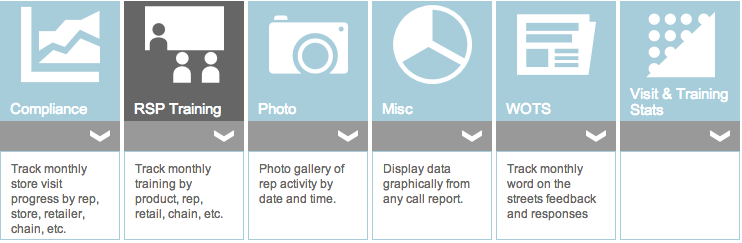
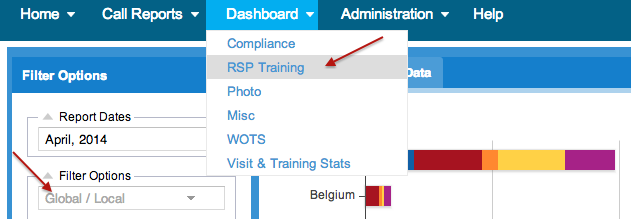
When you click on "RSP Training" from Dashboard sub menus, you will be able to view monthly RSP training progress.
Graphical view vs. Data view:
There are three views (tabs) in this report page as shown below.
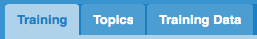
'Training' view (default) and 'Topics' view give graphical representation (histograms) of results, where as 'Training Data' view gives tabular view of results.
Data view shows the result on the page as well as give the option to download the report as excel spreadsheet.
Graphical View:
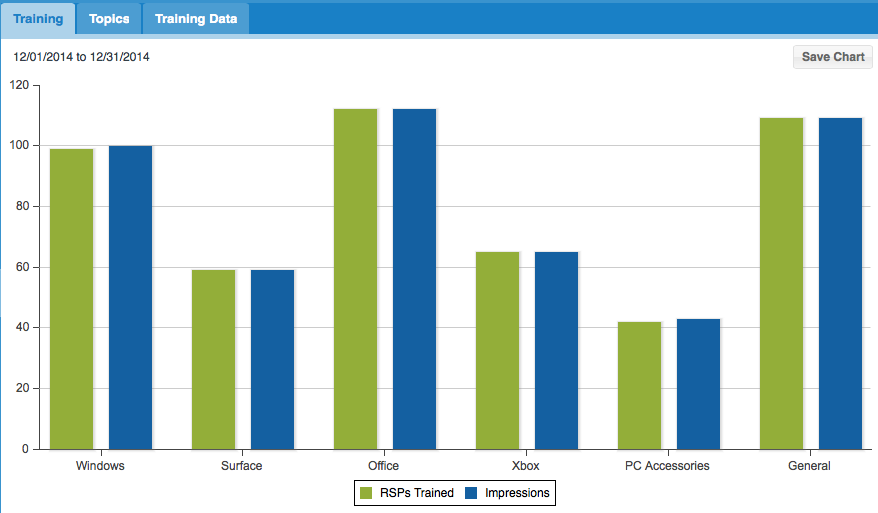
'Training' view fetches high level results related to the number of RSPs trained and the impressions delivered with a product wise split (as shown below). This view does not give a training topic level split. There is an option to save / download this chart as a picture file ('Save Chart' button on top right corner)
'Topics' view gives a bit more granular representation of RSP training report for the month (and other filters chosen). Please see a sample below.
Double clicking on the individual bar or pie will drill down in to various topic level reports for that product.
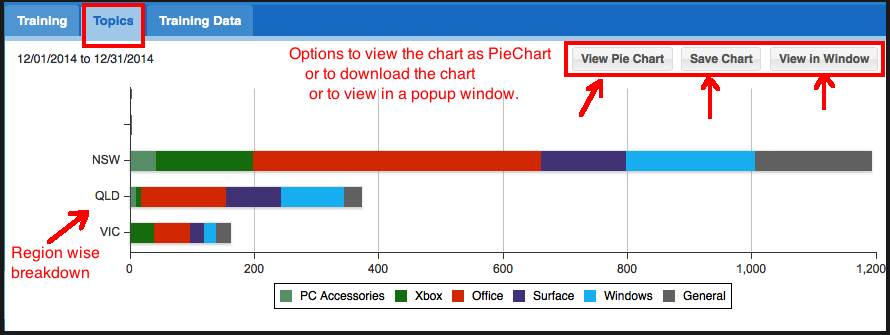
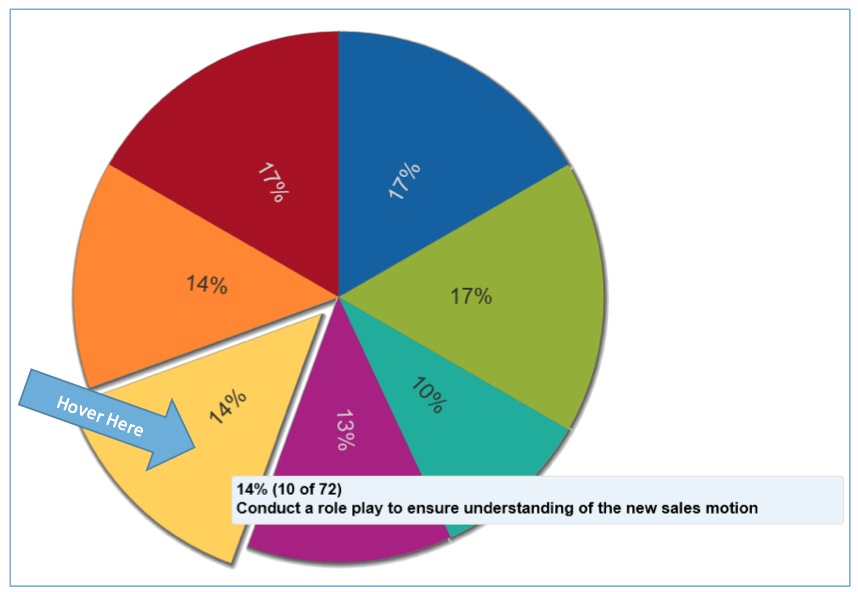
Hovering over the chart in either pie chart or bar chart format will produce instant detail for that section of the chart.
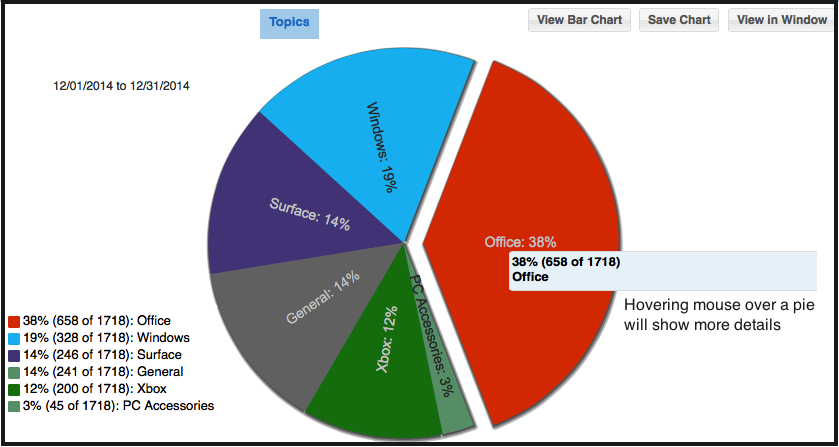
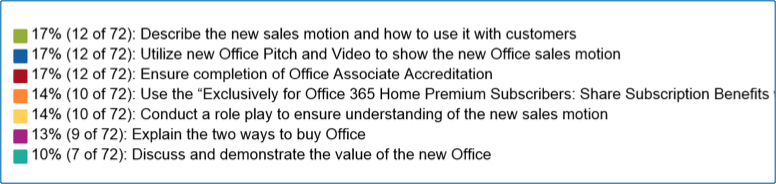
Below the pie charts you will be able to see legend details that explain what the pieces / colors of the pie represent.
Switching to a bar chart using the "View Bar Chart" button in the upper right hand corner will allow additional detail by region. Click "View Pie Chart" to return to the other chart type.
The "Save Chart" button in the upper right hand corner of the chart area allows you to save / download the chart as a PNG file image. You can use this image in email correspondence, reports and presentations.
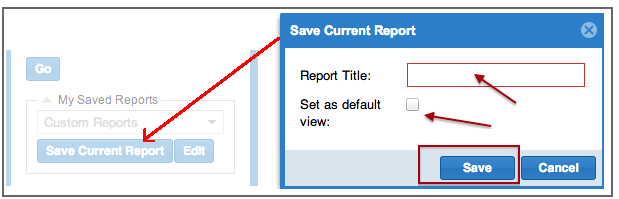
Just like in Compliance report, you can save the current query/filters by clicking on the "Save Current Report" button at the bottom on left pane. It opens a pop up windows where you can enter your preferred title for the query. Checking the 'Set as default view' box will ensure this query is run by default the next time you come to this report. "Edit" button beside 'Save Current Report' button lets you choose and edit one of the previously saved report queries. On the graph, you can drill into more details double clicking on the bars or pies. Corresponding filter condition is automatically set on the left pane.
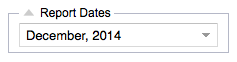
Various report-months can be chosen, current month being the default.
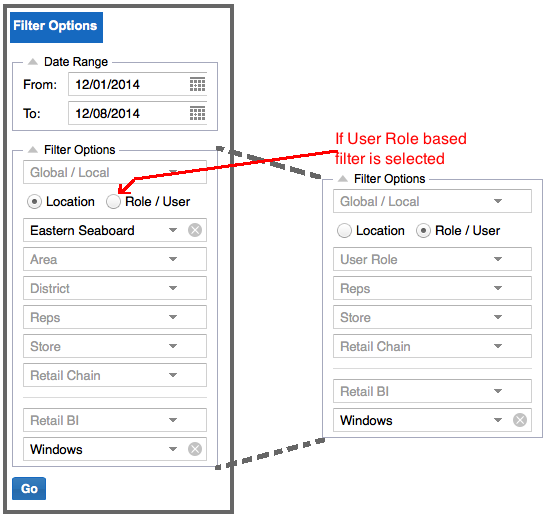
For Graph view (Training Tab), the following are the various filter options:
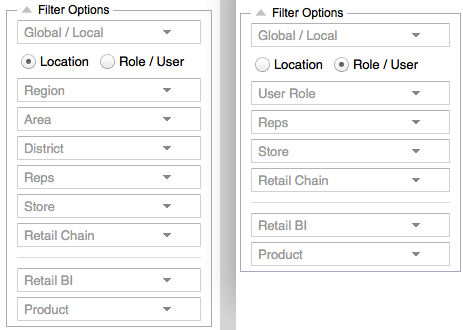
Default report view considers data pertaining to all global and local questions in the RSP training form. Just like in Compliance dashboard reports, under Location category, you can apply sub-filters based on regions and sub regions as designed in store management page. Role based filters allow sub filters based on various user roles defined in user management page. For a selected user role, you can further filter on individual user names and the stores the user is assigned to. Both user role based and location based filter options allow Retail Chain and Retail BI sub filters to focus the results on the line of business.
Note:
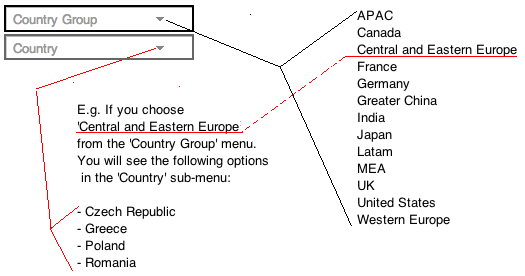
For Global Read Only Users, 'Training Engagements' report will show 2 additional location based filtering options 'Country Group' (A13) and 'Country' as shown below.
Data View:
A typical date view appears like shown below:
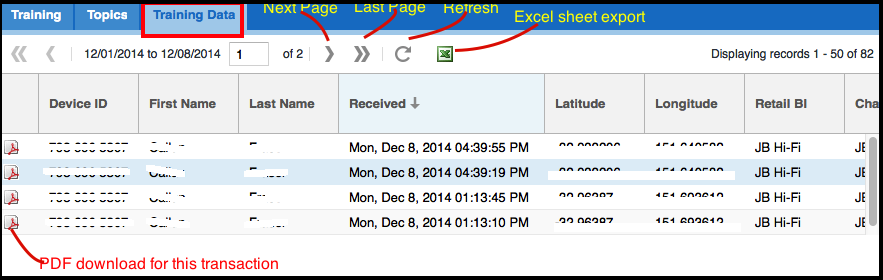
Each record can be downloaded as a .pdf file. The entire report can be downloaded in excel format. Various columns displayed include user details, device details, form fields, location details, form submission start time, end time, duration, trainer signature etc. If there are more data than one page can display, records are paginated. You can navigate across the pages using the controls shown in the picture above. Clicking on the columns will sort the report based on that column values.
For Data view, the following are the various filter options: