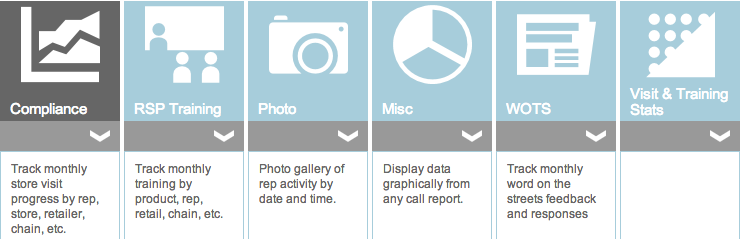
Compliance Report Dashboard
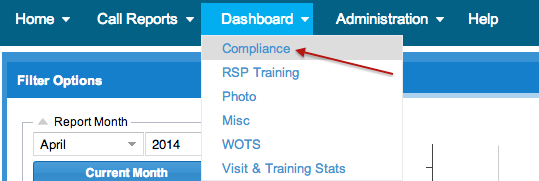
When you click on "Compliance" in the main menu, you will be taken to the Compliance Chart tab with the Region level view as default (as shown below):
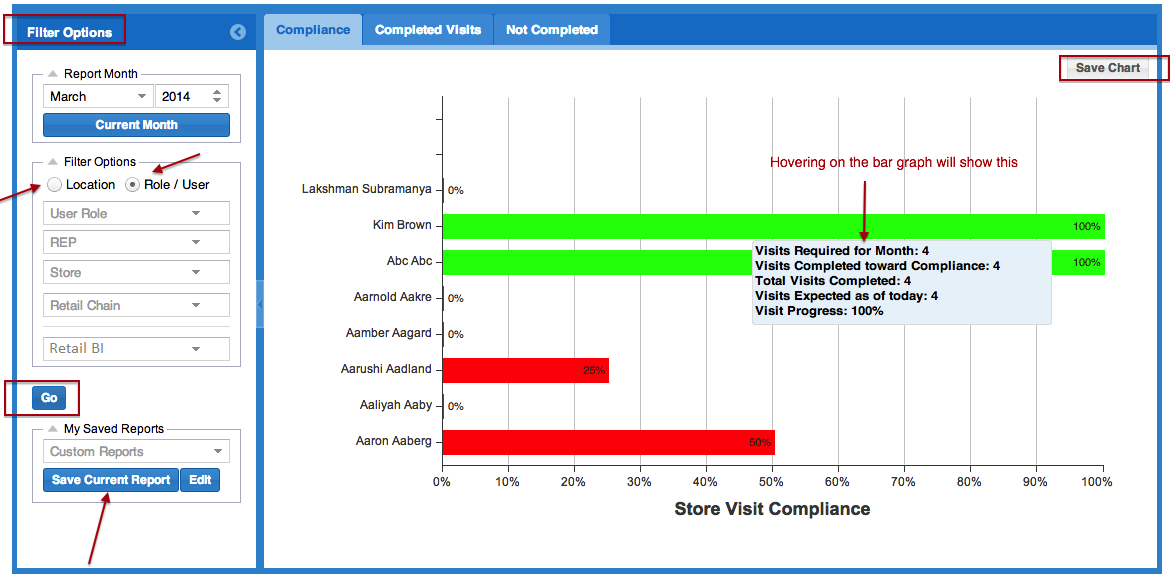
On the left panel, you can select the report month and filter options based on store location or user roles. You can just press "Current Month" to return to the present month.
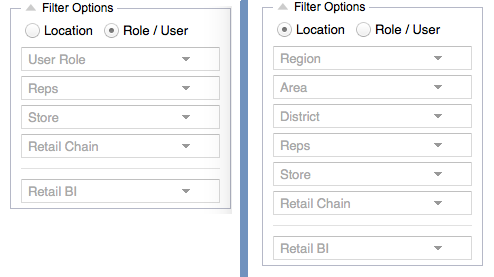
Location based filter options allow sub filters based on regions and sub regions as designed in store management page. User Role based filters allow sub filters based on various user roles defined in user management page. For a selected user role, you can further filter down on individual user names and the stores assigned to the user. Both user role based and location based filter options allow Retail Chain and Retail BI sub filters to focus the results on the line of business.
Once you have chosen the filters, click on the 'Go' button to view the report (horizontal bar graph) on right panel.
Note:
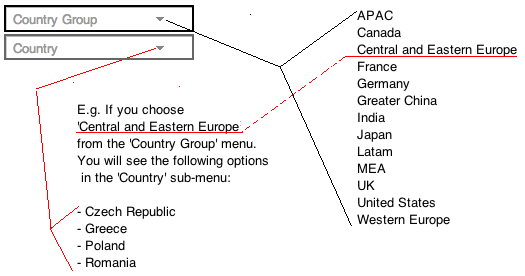
For Global Read Only Users, 'Store Visits' report will show 2 additional location based filtering options 'Country Group' (A13) and 'Country' as shown below.
Clicking on the individual bars will drill down to the next level of results. For example, if you have configured your store location hierarchy as 'Region' > 'State' > 'District' > etc., the initial bar graph will show the compliance statistics for different regions in your country. Clicking on one of the bar item will drill down in to that region and will show the compliance statistics for various states in that region and so on and so forth. The bar graph is color coded based on compliance level effective on the day when the report is generated. Compliance Level of 90% or above will be shown in green, 85% - 89.9% will be shown in yellow and anything below 85% will be shown in red.
If a representative has done more store visits than required to meet his/her compliance level, the percentage figure will be shown as 100+%. For incomplete current months, all figures are prorated (calculated for the portion of the month completed). That is, if the frequency of store visit is set to 8 per month for a user and if we're only halfway through the month, the number of visits expected up to that point in the month would be taken as 4. If the rep is ahead of schedule and has already completed 5 visits to that store, then the report would show 100+%. However, the system does not allow the number of visits completed figure to ever be higher than the full frequency number for the month, which in this example would be 8.
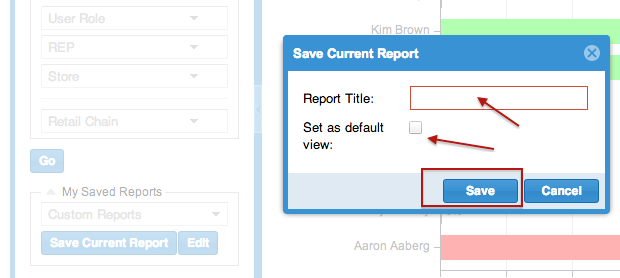
You can also save the current query/filters by clicking on the "Save Current Report" button at the bottom on left pane. It opens a pop up windows where you can enter your preferred title for the query. Checking the 'Set as default view' box will ensure this query is run by default the next time you come to this report. "Edit" button beside 'Save Current Report' button lets you choose and edit one of the previously saved report queries.
On the bar graph, you can drill into more details double clicking on the bars (E.g. To view the individual visits to a store). Corresponding filter condition is automatically set on the left pane. You can also hover your mouse cursor over the bars to get more details.
The "Save Chart" button in the upper right hand corner of the chart area allows you to save / download the chart as a PNG file image. You can use this image in email correspondence, reports and presentations.
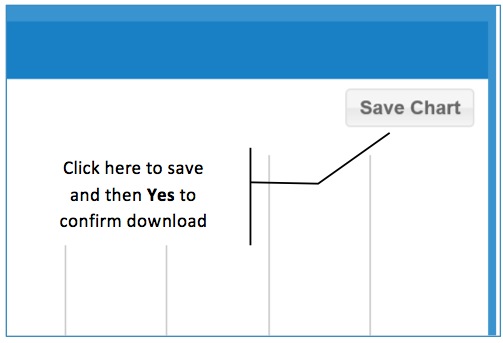
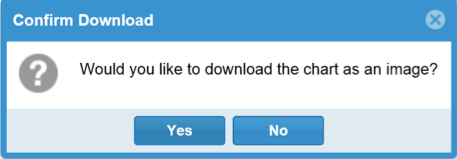
Click Yes in the confirmation pop up to save the file.
On the right panel, to the right of 'Compliance' chart tab, there are two more tabs: Completed Visits & Non Completed (visits)
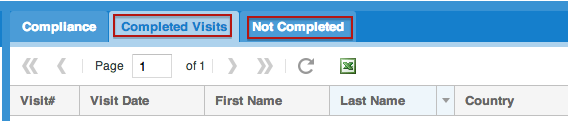
'Completed Visits' tab will display tabular data of every store visit that your reps have completed in the month selected on the filter options on the left.
'Not Completed' tab will display every store visit that your reps are yet to complete in the month selected on the filter options on the left.
The number of store visits is determined based on the visit compliance level (visit frequency number) set during Store Assignment. For example, if you have set a rep visit the same store 5 times in a month, and that rep has only completed 2 of those visits, you should expect to see 2 rows (records) in 'Completed Visits' tab and that same store will be listed 3 times in the 'Not Completed' tab.
At the beginning of each month, you should expect to see most of the stores in the 'Not Completed' tab and few in the 'Completed Visits' tab. At the end of the month, you would expect to see the reverse: most stores in the 'Completed Visits' tab and less in the 'Not Completed' tab. The benefit here is as you get to the end of the month, a Manager or Administrator can view and export what is left as it relates to store visit compliance.
As shown below, you can use any of the existing filter options to maximize or limit your view as desired (controls on the left). Select the Go button to update your list.
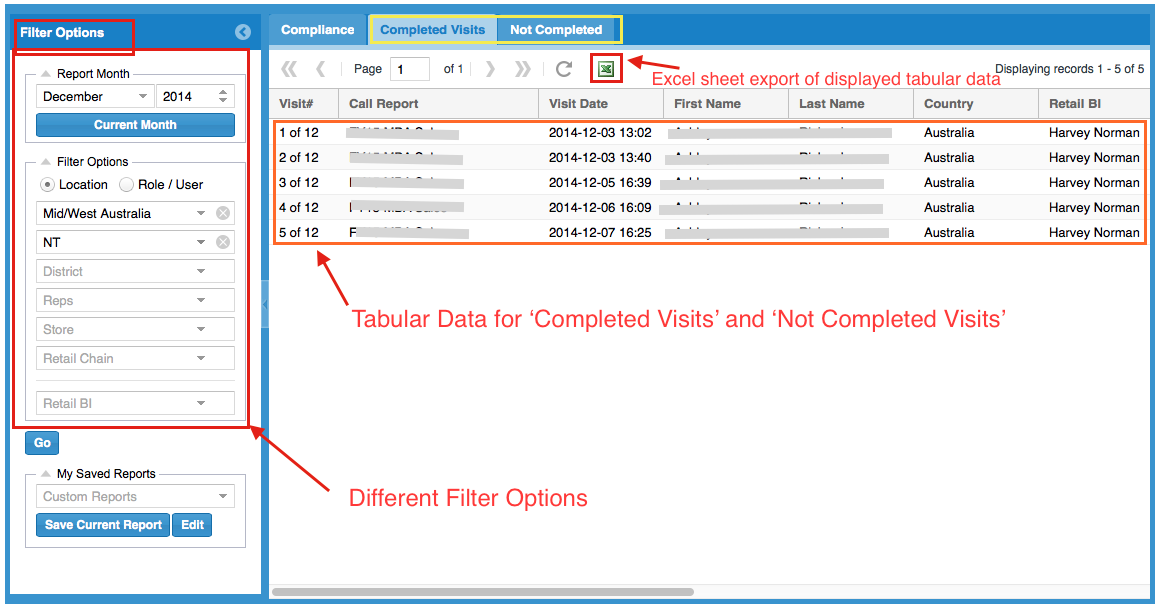
Lists for both Completed Visits and Not Completed tabs include:
• Visit # (if a store needs to be visited 4 times, this will list as the 1 of 4, 2 of 4, etc.)
• Visit Date
• First Name (of rep)
• Last Name (of rep)
• Country
• Chain
• Chain Category
• Store Name
• Store Address
• Store State/Province/Country
• Store Postal Code
Once you have displayed the data in which you want using the filters in the right, you can easily export this information using the MS Excel icon export button.